3.2 Perceptual color and trichromatic vision⧉
Color has several meanings from physical to different layers of perception and all these stages matter to photography and can be the cause of much confusion. This chapter opens that pipeline in order: from physical color (a spectrum), to three cone responses, to the opponent recoding. Each stage is a different, equally valid answer to "what color is this." The higher-level assessments built on top of it (illuminant discounting, color constancy, color names, and focal prototypes), together with the rest of human vision (light adaptation, contrast, spatial and temporal sensitivity, and attention), are taken up later in this part, in Visual processing.
One important lesson of this chapter and the next is that visual perception is measurable. Psychophysics, the experimental study of the map from stimulus to sensation, is quantitative and reproducible. Color-matching, hue-cancellation, and contrast-sensitivity experiments return tight numbers that repeat across observers and across laboratories, solid enough to be frozen into standards such as the CIE standard observer and the perceptual models inside every camera and codec.
3.2.1 Cone Photoreceptors and Perceptual Color⧉
Even though cones are known to be the color vision receptors, a single cone does not measure wavelength — it produces one number, and stimuli of different wavelengths can yield the same response.
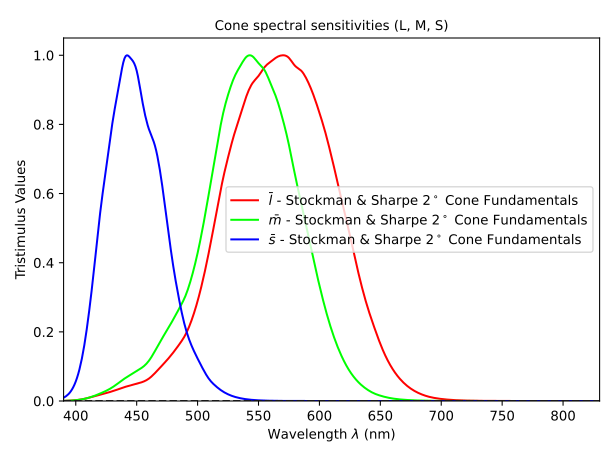
A given cone type $k$ has a spectral sensitivity $c_k(\lambda)$: a curve saying how strongly it responds to light of each wavelength (Figure 3.2.1).
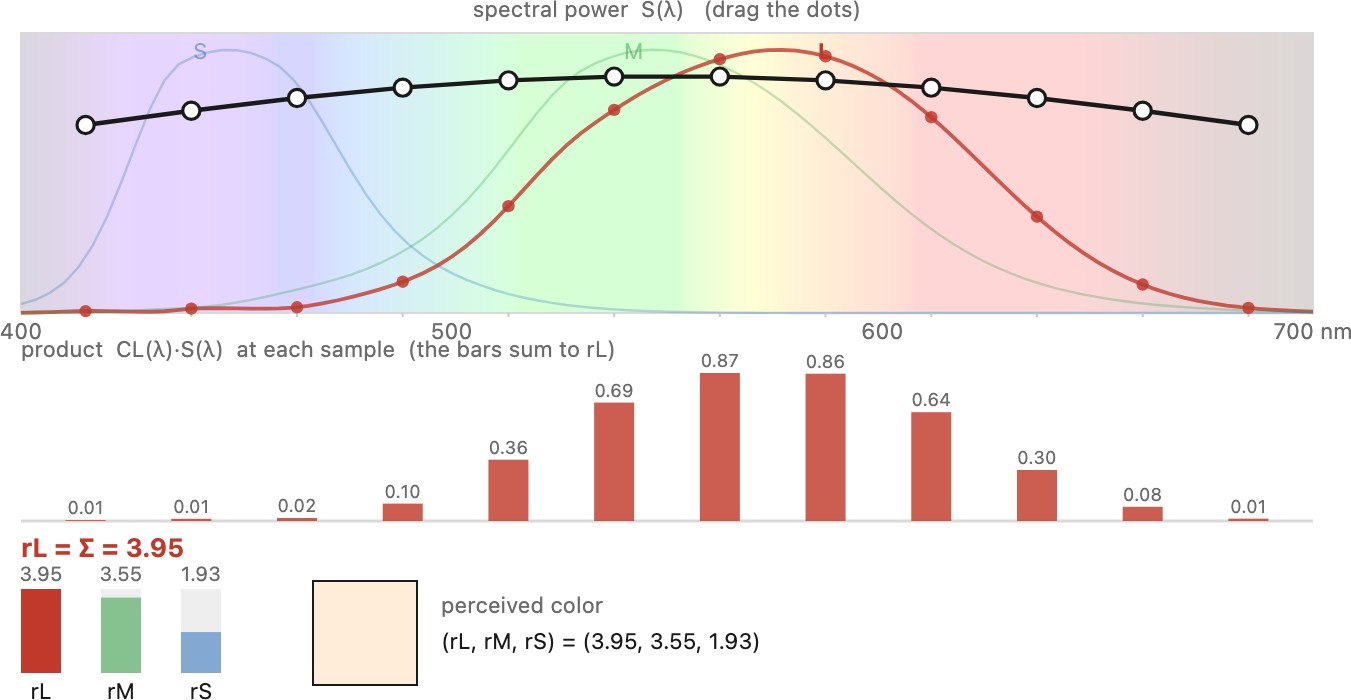
When light with spectrum $E(\lambda)$ arrives, the cone reports a single response, the spectrum weighted by its sensitivity and summed over all wavelengths (Figure 3.2.2):
Mathematically this is a dot product. In the case of monochromatic light (a single wavelength $\lambda$) it reduces to the scalar product of the cone's sensitivity at $\lambda$ and the light's intensity for $\lambda$.
As Figure 3.2.3 shows, lights at different wavelengths can yield the same response if their intensity ratio is the inverse of the cone's spectral response ratio for those two wavelengths. A cone conflates color with intensity.
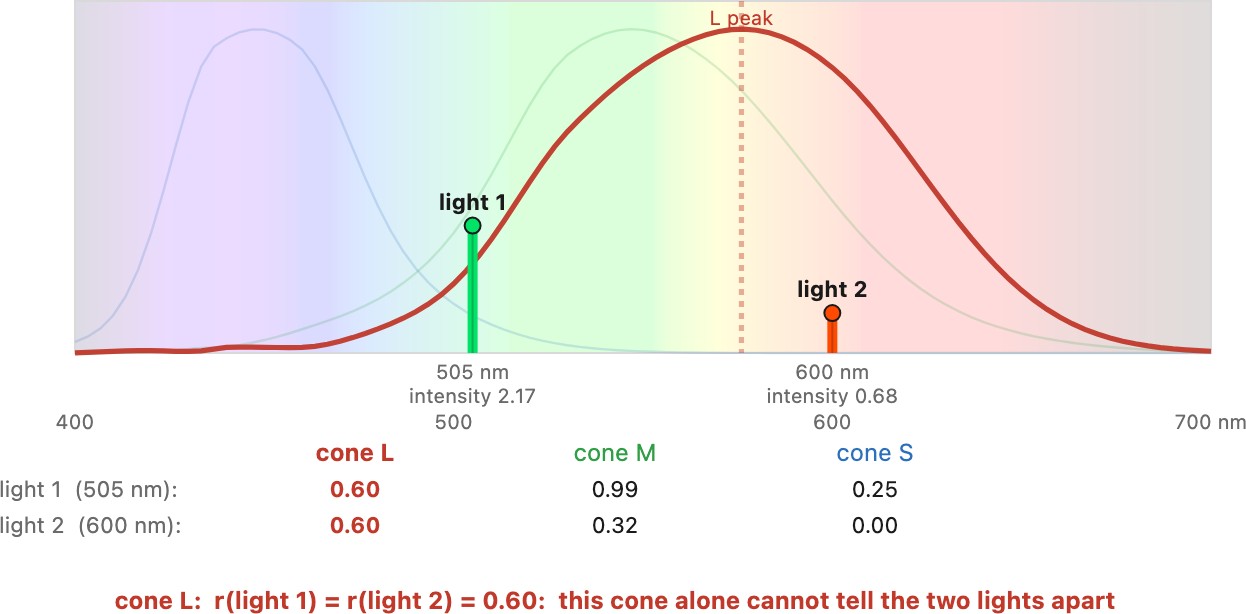
While a single cone cannot distinguish wavelength, the combination of three cone responses provides much more information (click on "show other cones" in Figure 3.2.3 ). This is the trichromatic theory of color vision, pioneered by Thomas Young and put on a quantitative footing by Hermann von Helmholtz. Three cone types give three numbers $(r_L, r_M, r_S)$, and that triple is all the information the eye keeps about the spectrum. An infinity of wavelengths collapses to three.
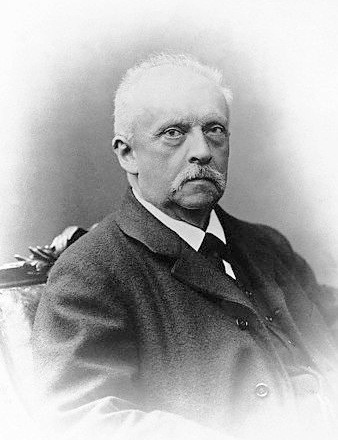 Hermann von Helmholtz (1821–1894) was the physicist and physiologist who turned Thomas Young's guess into a working theory. Young had argued decades earlier that the eye cannot possibly carry a separate detector for every wavelength and must instead make do with a few receptor types; Helmholtz developed this quantitatively, and the three-receptor account of color vision is still called the Young–Helmholtz theory. His Handbook of Physiological Optics founded the field, and he invented the ophthalmoscope that let physicians look into the living eye. Two of his ideas run straight through this chapter. The first is trichromacy itself, the L/M/S projection that everything here is built on. The second is unconscious inference, his claim that perception is not a direct readout of the retina but an inference the brain makes about the most likely cause of its input. That is exactly the stance we take later on color constancy, white balance, and "the dress," where the visual system guesses the illuminant and quietly discounts it. Beyond vision he is everywhere in physics as well, from the conservation of energy to the Helmholtz free energy and the acoustic resonators that carry his name. Portrait: 19th-century photograph, public domain (via Wikimedia Commons).
It helps to make the projection concrete as linear algebra. Discretize the spectrum into $N$ wavelength bins $\lambda_i$ and stack the samples into a vector $\mathbf{E} \in \mathbb{R}^N$. Stack the three sensitivity curves as the rows of a $3 \times N$ matrix $\mathbf{C}$, one row per cone type. Then the three cone responses are just a matrix–vector product,
(Figure 3.2.4). In reality wavelength is continuous, so $N \to \infty$ and the sum becomes the integral above: color sensing is an infinite-dimensional input squeezed through a three-dimensional bottleneck.
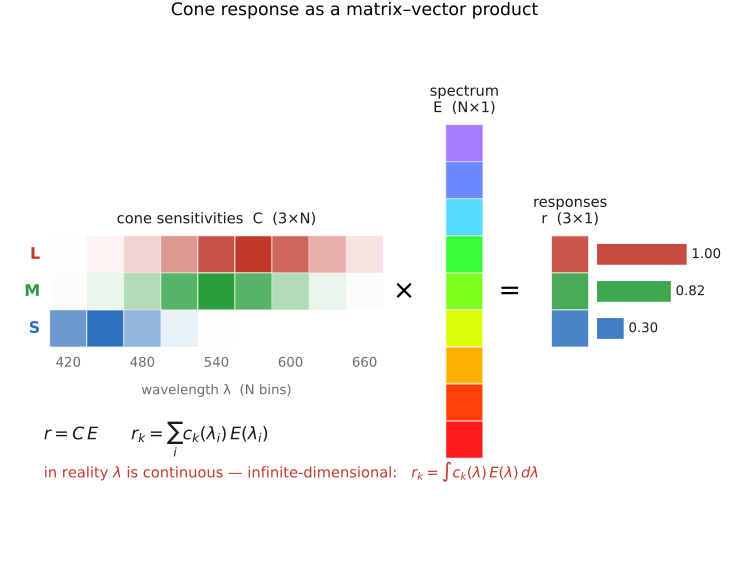
Each of the three cone types reports one number: the integral over wavelength of the incoming spectrum times that cone's spectral sensitivity — a projection (dot product) of the spectrum onto the cone curve, $r_k=\sum_i c_k(\lambda_i)\,E(\lambda_i)=\mathbf c_k\!\cdot\mathbf E$. Three cones → three dot products → the entire input to human color. Everything else about color — metamerism, "primary" colors, the color-matching matrices of Measuring and encoding color — follows from this one fact: color is three dot products with three fixed curves.
We established above that a single cone cannot distinguish wavelengths. Only by comparing the three cones' outputs can the brain begin to separate the two. However, this ability is limited. This is unsurprising because trichromatic vision summarizes a whole spectrum with only three numbers.
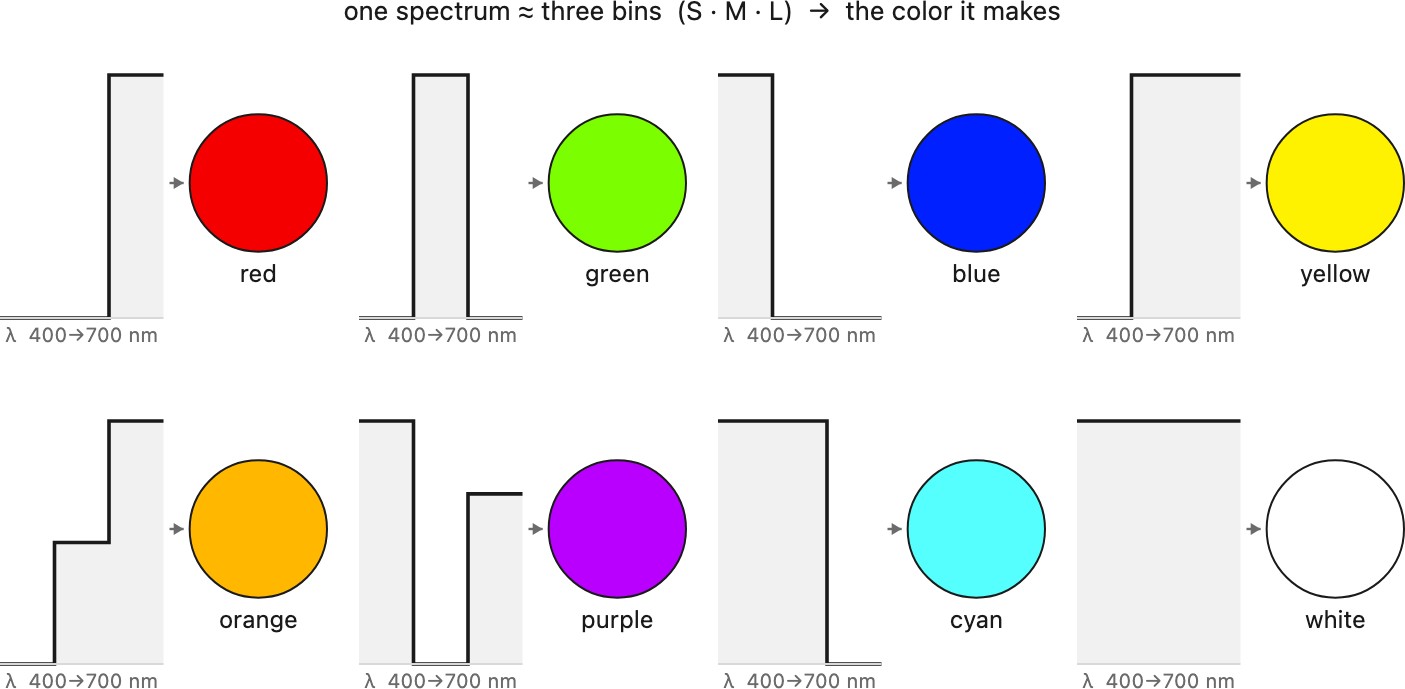
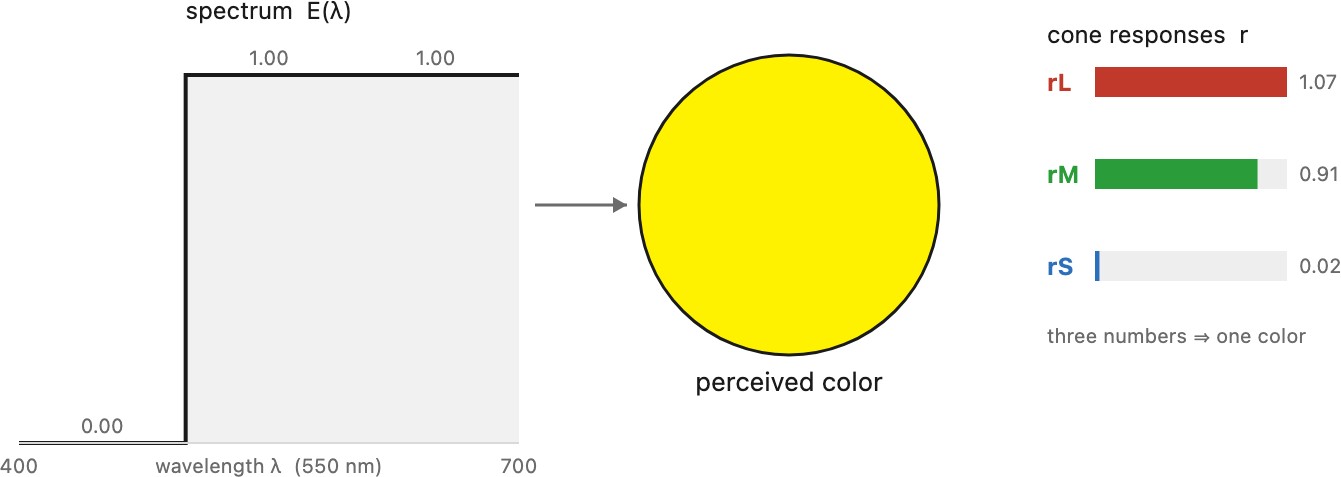
A few simple cases make the three-number code concrete. Split the visible spectrum into just three coarse bins, long, middle, and short, and read off how much each cone catches. A pure long-wavelength light lights up the L cone and little else: red. A short-wavelength light drives S: blue. Put the energy in the middle bin and L and M respond together while S stays quiet: green. Fill both the long and middle bins with little short, and L and M fire together again, yet now the eye reads the pair as yellow, the sign that yellow sits right next to green in cone space. Broaden the light until all three bins are roughly equal and all three cones fire equally: white (or gray). Mixtures in between name the rest of the hue circle: orange (mostly long, some middle), cyan (middle plus short), purple (long plus short, skipping the middle). The point is not the exact numbers but the shape of the code: every color you can name is a ratio of three cone catches, and, as we are about to see, very different lights can land on the same ratio. The cartoon examples below make this visible by collapsing the spectrum to three bins, with an interactive version where you dial each bin yourself.
3.2.2 Metamers⧉
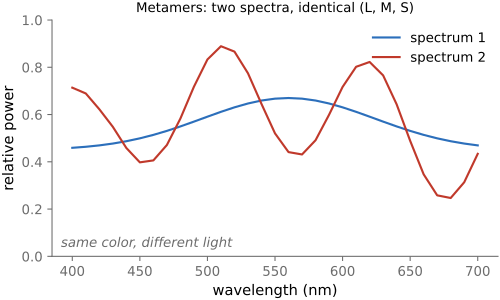
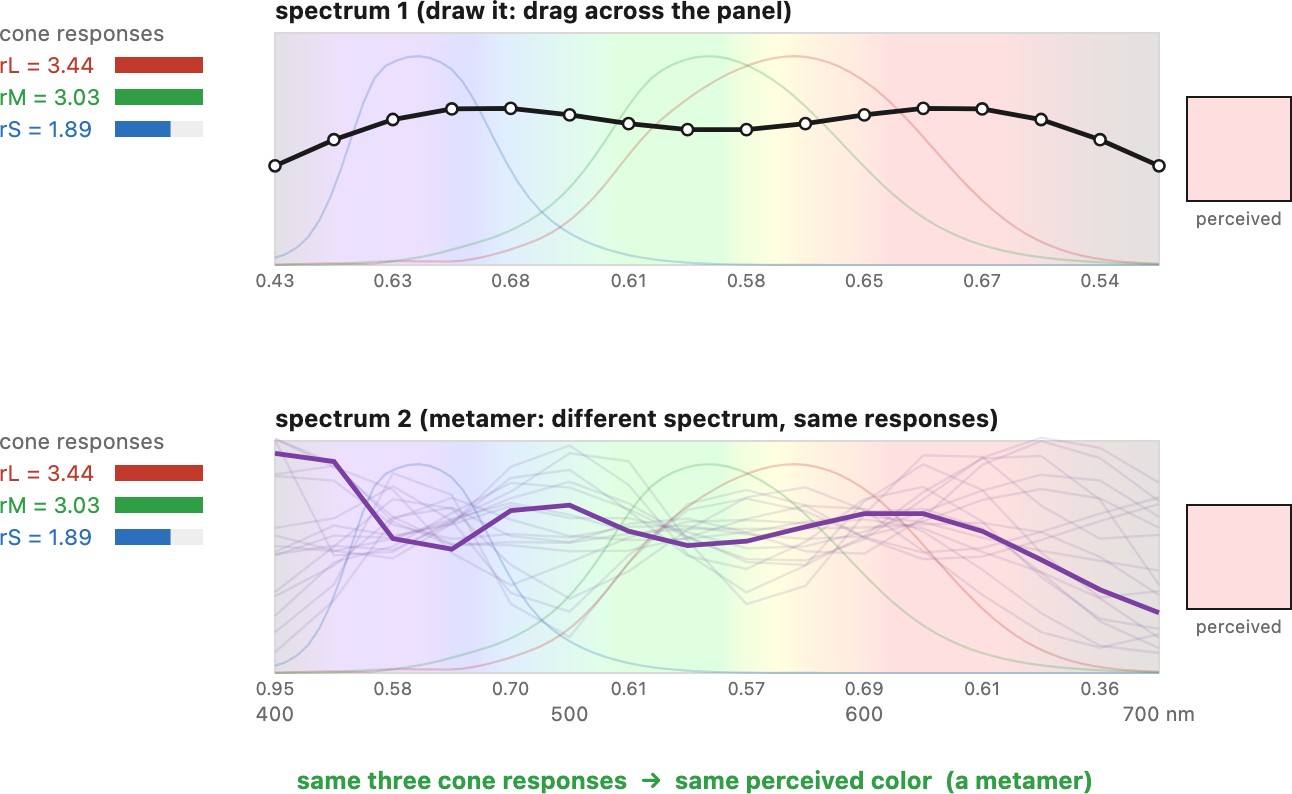
Because the map $\mathbf{E} \mapsto \mathbf{r}$ is a projection from infinite dimensions to three, it has an enormous null space: vastly many different spectra produce the same triple $(r_L, r_M, r_S)$ and therefore look exactly the same. Two such spectra are called metamers. While it limits our ability to distinguish physical colors, metamerism is also what makes color reproduction possible at all. A screen with only three primaries can match (almost) any real spectrum, not by reproducing it, but by producing a metamer of it. The whole edifice of color technology in Measuring and encoding color rests on this.
Because color is only three dot products (L2.10), the map from spectrum to response has a huge null space: infinitely many different spectra collapse to the same triple and look identical — they are metamers. This is at once bad news — the eye throws away almost all spectral information, and two objects that match under one light need not be the same physically — and good news — you can reproduce any color with just three primaries, which is the only reason displays, prints, and the whole of color technology can exist.
Look again at the cone curves: the M ("green") sensitivity is entirely overlapped by L and S, so no real light can excite M without also exciting its neighbors. Every natural color is therefore a blend of cone activations, and the rainbow of nameable hues is exactly the set reachable by such blends. In 2025 a Berkeley team led by Ren Ng and Austin Roorda asked what lies outside that set. Their system, Oz (Fong, Doyle, Wang et al. 2025) uses adaptive optics to image the living retina and classify each cone by its type (L, M, or S — the technique of Roorda & Williams 1999), tracks the eye's constant fixational tremor at cellular scale, then delivers tiny laser microdoses to individually chosen cones (hundreds of thousands per second), each landing on the cone it was aimed at despite the moving eye. By addressing only the M cones at population scale it drives a pattern of cone activation that no spectrum of light could ever create, precisely because it sidesteps the cross-talk above. Observers report a color of impossible saturation, a blue-green they named "olo," so far outside the natural gamut that it can only be matched by conventional light after it is desaturated with added white. The boundary of human color is not set by the eye's wiring but by the overlap of the cone curves: bypass the overlap by addressing cones individually, and you reach colors evolution never let us see. (It is the experimental mirror image of metamerism: metamerism is many spectra, one response; Oz is one response no spectrum can make.) Mechanically, Oz is the extreme of retinal projection (writing an image straight onto the photoreceptor mosaic), the frontier taken up in Retinal projection.
Most uses of metamerism save spectral information: three primaries stand in for a whole spectrum. Dolby 3D turns the idea sideways and uses it to separate two images that must look identical. A color 3D projector has to send a full-color picture to your left eye and a different full-color picture to your right eye off a single screen. Polarized systems separate the two channels by polarization; the old red/cyan anaglyph separates them by hue, at the cost of color. Dolby's system, the Infitec method of Jorke and Fritz (Jorke & Fritz 2003), separates them by wavelength. It splits each of red, green, and blue into two narrow bands (a "low" red near 629 nm for one eye and a "high" red near 615 nm for the other, and likewise for green and blue) and shows the left-eye image with one triplet of bands, the right-eye image with the other. The glasses carry matched interference (dichroic) filters: the left lens passes only the left triplet, the right lens only the right triplet, so each eye sees only its own image and the two stereo channels never cross. Metamerism is what makes the split invisible. The left eye's "red" (629 nm) and the right eye's "red" (615 nm) are physically different spectra, yet they are chosen and color-corrected so that both project to nearly the same three cone responses. They are engineered metamers. Both eyes therefore see the same red, the same full-color palette, even though the two eyes share no wavelength at all. This is the constructive side of metamerism (L2.11) pushed to its limit: not one spectrum standing in for another, but two deliberately non-overlapping spectra built to be color-identical, so one screen can feed two eyes at once. The price is in the glasses (precise multilayer dichroic coatings, far costlier than a sheet of polarizer or dyed plastic), plus a little light lost to the narrow bands, which is why you meet Dolby 3D in cinemas rather than living rooms.
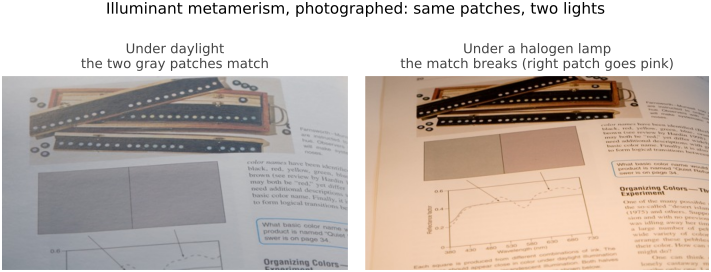
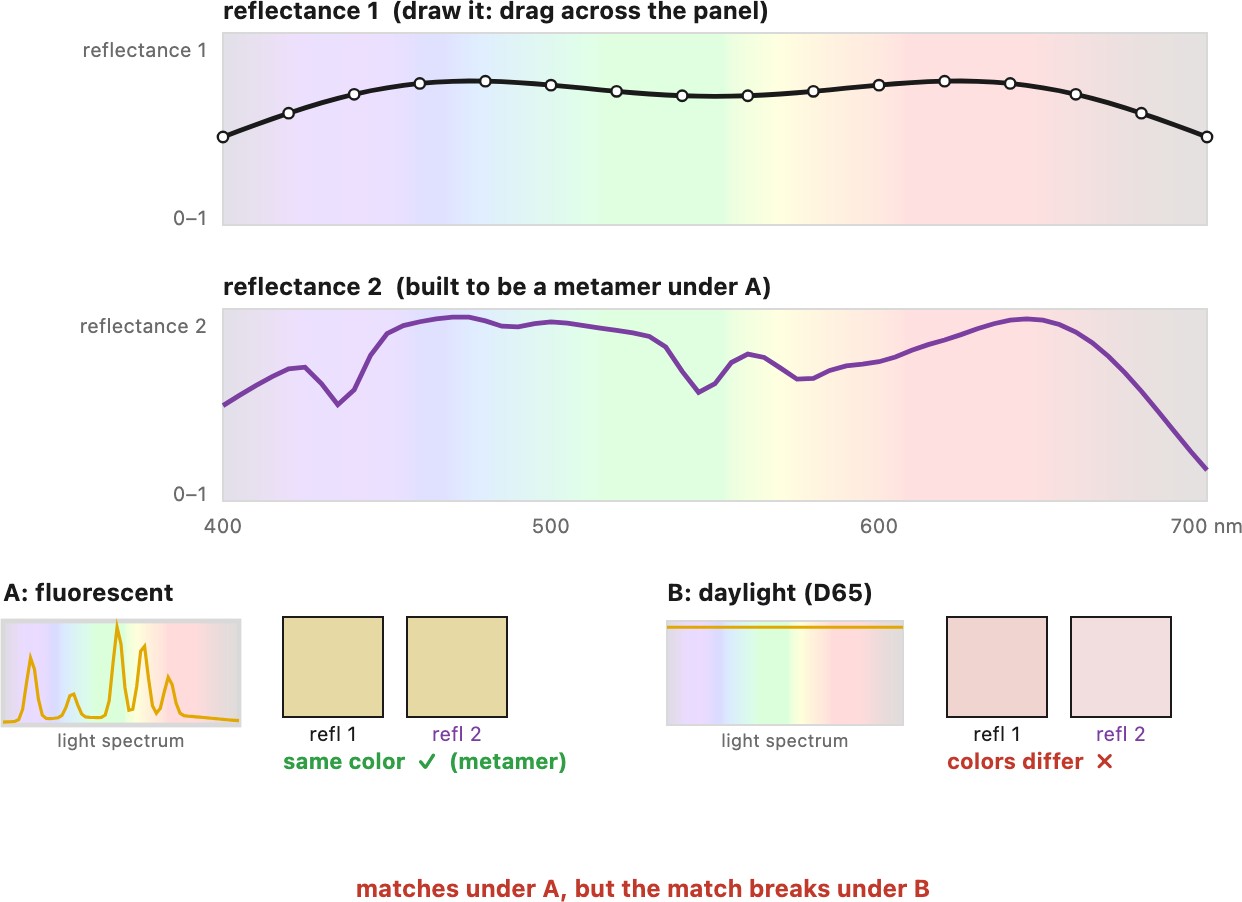
Metamerism also has an important limitation, and it follows from Big lesson L2.6: the light that reaches the eye is the product of a surface's reflectance and the illuminant (→ see , illumination × reflectance), so a metameric match is really a match between two products. Change the illuminant (daylight for shop fluorescent, sunlight for tungsten) and you multiply both spectra by a different shape, and two reflectances that matched under one light can visibly diverge under another (Figure 3.2.11). The damage is worst under spiky illuminants (fluorescent tubes, white LEDs, sodium lamps), whose spectra are a few narrow peaks rather than a smooth curve. A spiky light samples the two reflectances only where its peaks fall, so small differences that a smooth daylight would average over get seized on and amplified, and the match falls apart. This is one of the situations where spiky illumination spectra are bad; we meet others under white balance and color rendering. The effect is easy to see for real (Figure 3.2.9): two gray patches printed as a metameric pair in Billmeyer & Saltzman's Principles of Color Technology look identical under daylight but split apart, one turning pink, under a warm halogen lamp. This illuminant metamerism is a real and expensive problem: a printer's inks are mixed to be a metamer of the target colors under the proofing light, then drift apart under the customer's living-room bulbs; and two pieces of an outfit, dyed to match in the shop, can clash in daylight. It is why color-critical work always specifies the viewing illuminant: "matches here" is never "matches everywhere."
A metameric match is a match between two products of reflectance and illuminant (L2.6). Swap the illuminant and you multiply by a different spectral shape, so two surfaces that looked identical under one light can diverge under another — illuminant metamerism. It is the headache behind prints that shift between the proofing booth and the living room, and fabrics that match in the shop but clash in daylight; color-critical work must always name the light a match is judged under.
3.2.3 Color blindness⧉
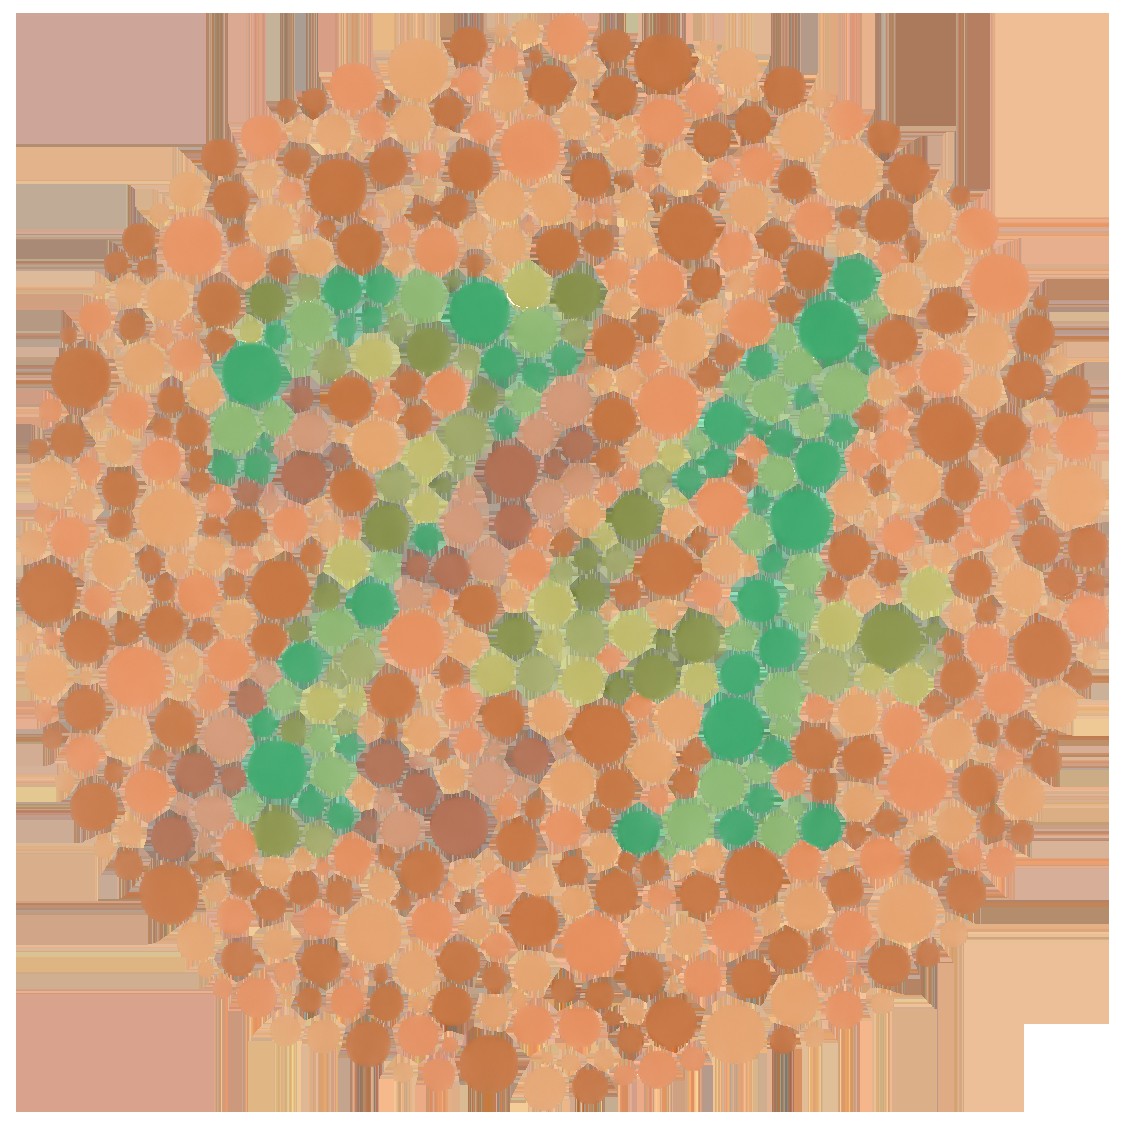
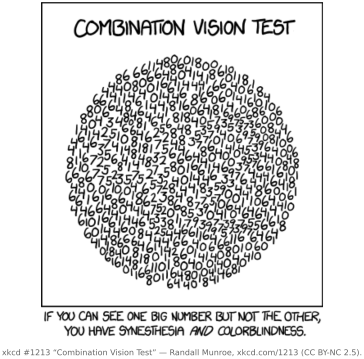
Color blindness is what happens when this projection loses even more information. A "dichromat" is missing one cone type (most commonly through the L/M genes), so the spectrum is projected onto two numbers instead of three; many spectra that look distinct to a trichromat now collapse into the same response — the classic red–green confusion. The standard Ishihara plates (Figure 3.2.12) exploit exactly this, hiding a figure that a trichromat sees and a dichromat cannot. The deeper point is one of perspective: a trichromat is also projecting away an infinity of spectral information. We are all color-blind relative to the full spectrum, and, as the Animal eyes chapter shows, relative to other animals too.
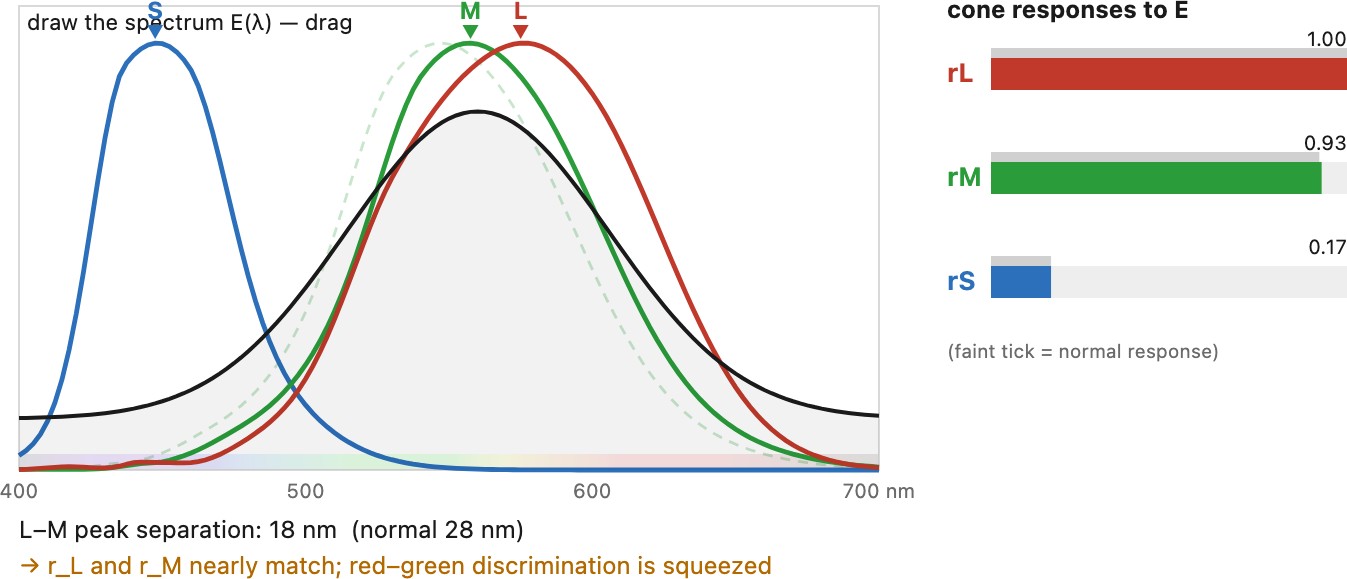
Color deficiency is a spectrum, not a switch, and it runs from mild to total. The mildest and most common form is anomalous trichromacy: all three cone types are present, but one of them, usually the L or the M, carries a shifted pigment whose peak sits closer to its neighbor's. The person still mixes three primaries, so they are technically a trichromat, but because two of the curves now overlap even more than usual, discrimination along the red-green axis is squeezed and colors that look distinct to others read as similar (protanomaly for a shifted L, deuteranomaly for a shifted M; the blue-yellow tritanomaly is rare). One step further is dichromacy, the missing-cone case above: only two working types, so a whole axis of color collapses (protanopia and deuteranopia for red-green, the rare tritanopia for blue-yellow). At the far end is monochromacy, essentially no color vision at all. Its most complete form, rod monochromacy or achromatopsia, has no working cones whatsoever: the world is seen in shades of gray by the rods alone, with the poor acuity and painful light sensitivity that come of having no daylight receptors. It is rare globally but reaches striking frequency on the Pacific atoll of Pingelap, the subject of Oliver Sacks's The Island of the Colorblind (Sacks, The Island of the Colorblind).
The prevalence has a genetic explanation worth spelling out. The L and M cone pigments are coded by genes that sit right next to each other on the X chromosome, and the two are so similar that they misalign and swap segments easily, which is exactly what produces the shifted or missing pigments above. Because the defect is X-linked and recessive, it hits men far harder than women: a man has a single X, so one faulty copy is enough, while a woman has two and a good copy on the other X usually masks it. The result is that red-green deficiency affects roughly one man in twelve but only about one woman in two hundred. (The same two-X arithmetic runs the other way, too: a few women carry a fourth distinct cone pigment and may be weak tetrachromats.) The blue (S) system, coded on a different chromosome and free of this swapping, is affected far more rarely and about equally in both sexes.
The prevalence, by type and sex, is summarized below.
| Deficiency | Kind | Men | Women |
|---|---|---|---|
| Deuteranomaly (M pigment shifted) | anomalous trichromacy | ~5% | ~0.4% |
| Protanomaly (L pigment shifted) | anomalous trichromacy | ~1% | ~0.03% |
| Deuteranopia (M cone missing) | dichromacy | ~1% | ~0.01% |
| Protanopia (L cone missing) | dichromacy | ~1% | ~0.02% |
| Red–green, all forms | ~8% (1 in 12) | ~0.5% (1 in 200) | |
| Tritan (blue–yellow) | rare, autosomal | ~0.01% | ~0.01% |
| Achromatopsia (rod monochromacy) | monochromacy | ~0.003% | ~0.003% |
Approximate prevalence of color-vision deficiencies by type and sex (figures typical of populations of European descent; red–green rates are somewhat lower in some other populations). The red–green forms are X-linked and so far commoner in men; the blue–yellow and monochromatic forms are not sex-linked and are rare in both.
Anyone can check their own color vision in a few minutes: the Ishihara plates are freely available online, and interactive arrangement tests (the Farnsworth-Munsell hue-ordering test and the screening test on EnChroma's site) give a finer readout, though a real diagnosis still wants a calibrated screen under controlled light. Help then comes in two flavors, neither a cure. In software, operating systems and design tools now ship colorblind modes and daltonization filters that remap an image to push confusable colors apart, and phones can simulate how a scene looks under each deficiency so designers can check their work. In hardware, notch-filter glasses (EnChroma is the best-known brand) cut a narrow slice out of the spectrum where the L and M responses overlap most, exaggerating the difference between whatever light does get through; they can make certain reds and greens jump out for some anomalous trichromats, but they add no missing pigment and do nothing for a true dichromat or monochromat. The honest summary is that every one of these tools reshapes the three (or two) numbers a person already has; none can restore a channel the retina never built.
3.2.4 Opponent process and the multistage model⧉
Finally, the brain does not stop at three cone numbers. It re-codes color through a multistage model (simplified here; the full version is in Reinhard et al., Color Imaging):
- Stage 1 — cones. Three heavily overlapping L/M/S responses, the projection above.
- Stage 2 — opponent recoding, in the retina and the lateral geniculate nucleus. The L/M/S signals are re-mixed into three opponent channels: light–dark, red–green, and blue–yellow. This decorrelates the channels (since L and M are so redundant, their difference carries the color information efficiently) and matches the four "unique hues" we feel, the subject of the next section.
- Stage 3 — appearance. A higher-level organization closer to hue, saturation, and brightness (a hue-saturation-value-like, or HSV-like, arrangement), where context, adaptation, and memory shape the final percept, the domain of color-appearance models in the next chapter.
The recoding is not arbitrary. Color names cluster around shared focal colors across unrelated languages (Berlin & Kay's classic study, and the broader World Color Survey), evidence that the structure is perceptual, built into the wiring rather than the culture. The recoding has support from two directions: psychophysics (Hurvich and Jameson's hue-cancellation experiments) and physiology (De Valois's recordings of opponent cells).
The two stages: color is trichromatic at the cones, then opponent in the retina and lateral geniculate nucleus. The three cone signals are recombined into three opponent channels: red–green (roughly $L - M$), blue–yellow (roughly $S - (L+M)$), and light–dark (roughly $L + M$, the luminance channel). In symbols this is just a fixed linear map,
with $\mathbf{M}$ a $3 \times 3$ matrix, the perceptual ancestor of the luma–chroma transforms (the $Y'C_bC_r$ of JPEG) we will use later (Figure 3.2.15).
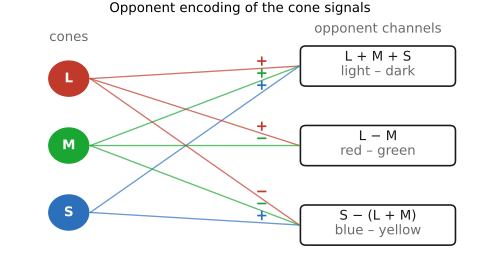
Human color is not computed in one step. Stage 1 is trichromatic — three cone projections (L2.10). Stage 2 recombines them into opponent channels — roughly luminance ($L+M$), red–green ($L-M$), and blue–yellow ($S-(L+M)$) — that is, differences, not raw cone signals. This two-stage structure is why there is no "reddish-green," why staring at red leaves a green afterimage, why "primary color" is so confused (cones vs. opponent hues), and why luma/chroma encodings and chroma subsampling work — luminance carries the detail, the chroma differences are smooth.
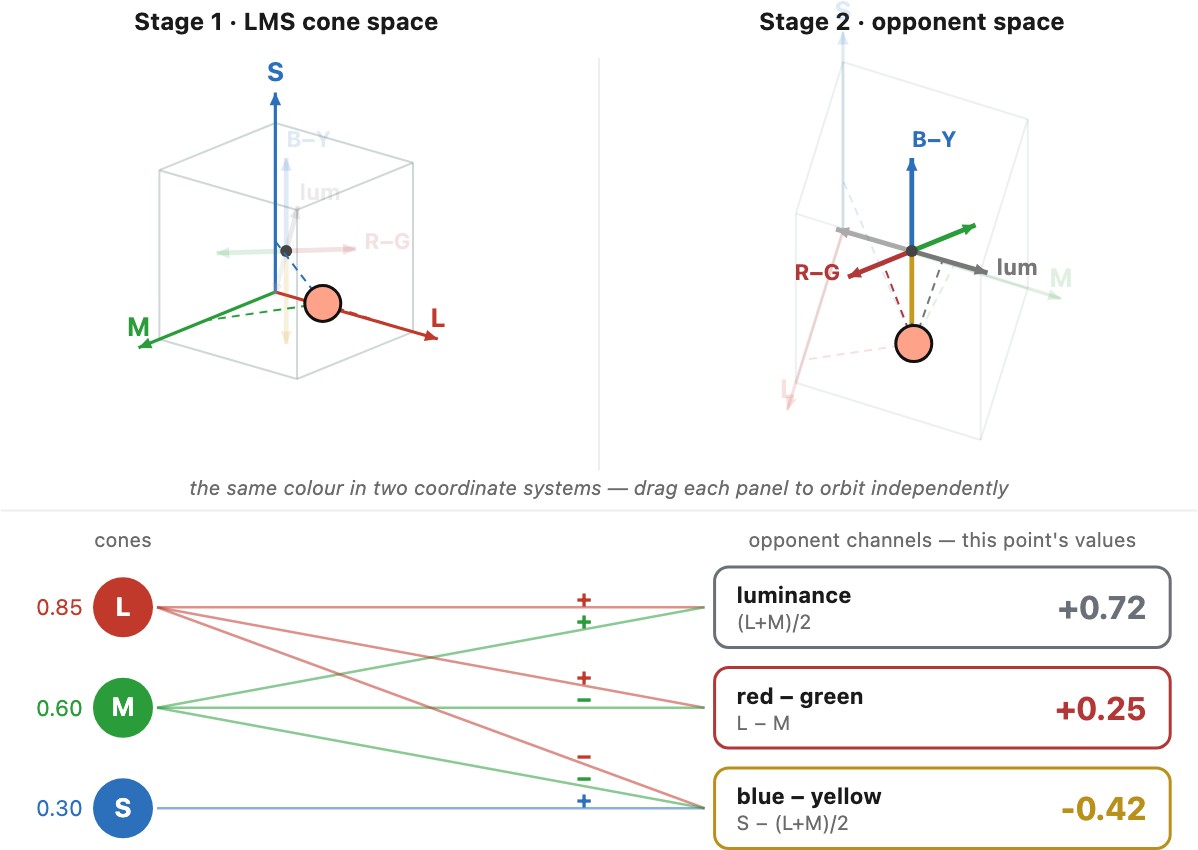
This model earns its keep in two ways. It explains afterimages: stare at a saturated red patch until the red–green channel adapts, then look at white and the channel rebounds the other way, painting a green ghost (likewise blue→yellow). And it explains why luma/chroma encodings compress so well: the luminance channel ($Y'$, computed on gamma-encoded RGB; see Linear vs gamma vs. log encoding in Measuring and encoding color) carries most of the detail we can resolve, while the two chroma channels can be heavily subsampled with little visible loss, the foundation of JPEG's chroma subsampling, and a direct prediction of the opponent model that we will confirm under Spatial vision.
3.2.5 So what are the primary colors?⧉
Everyone has argued about this. Is it red-green-blue (RGB)? The grade-school red-yellow-blue (RYB)? Cyan-magenta-yellow (CMY)? The perennial muddle has two separate causes, and neither of them is a fact about light.
The first cause is the opponent recoding we just met. Because the visual system re-wires the three cone signals into red–green, blue–yellow, and light–dark, red, green, blue, and yellow all feel "primary" to us perceptually: there are four psychological unique hues, not three. This is why red-yellow-blue feels so natural to painters, and why the cones' actual L/M/S sensitivities match nobody's intuition of "primary" colors: our intuition is reporting the opponent stage, not the cones.
The second cause is additive versus subtractive synthesis, a matter of technology (taken up fully in Measuring and encoding color). RGB are the additive primaries, the colors of light you add together on a screen. CMY are the subtractive primaries, the inks or filters that remove light from white. The grade-school RYB is just a folk approximation of subtractive mixing.
So "primary color" silently conflates a perception fact with a technology choice: two different questions with two different answers, neither of which is intrinsic to the physics of light. As the lecture put it, the opponent rewiring "is one of the many causes of all the confusion about what's a primary color." (See the Glossary entry for primary.)
3.2.6 Color as linear algebra⧉
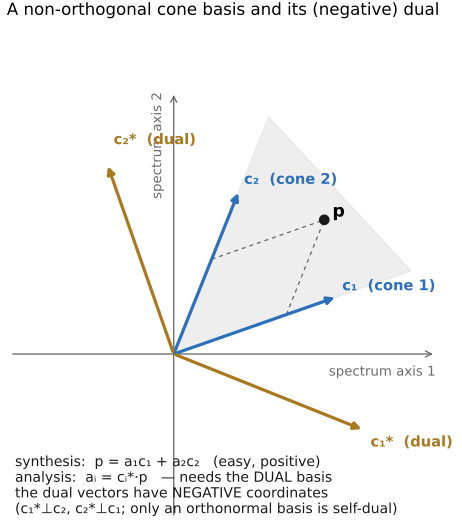
Going from physical color to the cone color is simple linear algebra. A linear projection or a big Nx3 matrix if you discretize wavelength. There is loss of information like with any projection, but the mathematical model is simple linear algebra. The part that makes the linear algebra messy is twofold. First, The three cone "axes" (the spectral responses) are not orthogonal: look again at Figure 3.2.1, where L and M overlap almost completely. Because $\mathbf c_L$ and $\mathbf c_M$ sit almost on top of each other across nearly the whole spectrum, their dot product $\mathbf c_L\!\cdot\mathbf c_M$ is large and positive: the two axes lean hard toward one another. In practice this means cross-talk: there is no physical light that stimulates M without also stimulating L and S. Shine any single wavelength and at least two cone types respond together; the M signal can never be moved on its own: the only way to move it alone is to abandon light and stimulate the cones directly, cone by cone (the Oz sidebar above, and its extreme form in Retinal projection). Second, spectra, being physical power densities, cannot be negative, so the cone responses as well as any light we may use to reproduce color may not be negative. Both facts conspire against the comfortable situation in linear algebra where bases are orthonormal and each axis can be handled independently and where negative numbers are available to span the whole space.
The cone "axes" overlap heavily (L and M are nearly redundant) and light cannot go negative — and those two facts are what make color algebra genuinely awkward. With an orthonormal basis, finding a vector's coordinates is just projecting onto the axes; here it is not. Recovering the coordinates of a non-orthogonal basis requires a so-called dual (reciprocal) basis, and for a positive, overlapping basis the dual vectors point partly into the negative quadrants — the natural analysis directions have negative coordinates, which physical light can never supply. This is the deep reason there is no perfect set of primaries to reproduce all colors. (→ see Big lesson: Human color is non-orthogonal and non-negative.)
Recap: big lessons of this chapter
Each of the three cone types reports one number: the integral over wavelength of the incoming spectrum times that cone's spectral sensitivity — a projection (dot product) of the spectrum onto the cone curve, $r_k=\sum_i c_k(\lambda_i)\,E(\lambda_i)=\mathbf c_k\!\cdot\mathbf E$. Three cones → three dot products → the entire input to human color. Everything else about color — metamerism, "primary" colors, the color-matching matrices of Measuring and encoding color — follows from this one fact: color is three dot products with three fixed curves.
Because color is only three dot products (L2.10), the map from spectrum to response has a huge null space: infinitely many different spectra collapse to the same triple and look identical — they are metamers. This is at once bad news — the eye throws away almost all spectral information, and two objects that match under one light need not be the same physically — and good news — you can reproduce any color with just three primaries, which is the only reason displays, prints, and the whole of color technology can exist.
A metameric match is a match between two products of reflectance and illuminant (L2.6). Swap the illuminant and you multiply by a different spectral shape, so two surfaces that looked identical under one light can diverge under another — illuminant metamerism. It is the headache behind prints that shift between the proofing booth and the living room, and fabrics that match in the shop but clash in daylight; color-critical work must always name the light a match is judged under.
Human color is not computed in one step. Stage 1 is trichromatic — three cone projections (L2.10). Stage 2 recombines them into opponent channels — roughly luminance ($L+M$), red–green ($L-M$), and blue–yellow ($S-(L+M)$) — that is, differences, not raw cone signals. This two-stage structure is why there is no "reddish-green," why staring at red leaves a green afterimage, why "primary color" is so confused (cones vs. opponent hues), and why luma/chroma encodings and chroma subsampling work — luminance carries the detail, the chroma differences are smooth.
The cone "axes" overlap heavily (L and M are nearly redundant) and light cannot go negative — and those two facts are what make color algebra genuinely awkward. With an orthonormal basis, finding a vector's coordinates is just projecting onto the axes; here it is not. Recovering the coordinates of a non-orthogonal basis requires a so-called dual (reciprocal) basis, and for a positive, overlapping basis the dual vectors point partly into the negative quadrants — the natural analysis directions have negative coordinates, which physical light can never supply. This is the deep reason there is no perfect set of primaries to reproduce all colors. (→ see Big lesson: Human color is non-orthogonal and non-negative.)